RTEC: Rockbridge Teacher Education Consortium
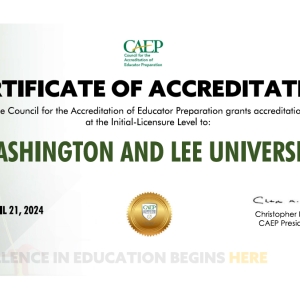
The Rockbridge Teacher Education Consortium (RTEC) is a collaborative teacher preparation partnership between Washington and Lee University and Southern Virginia University. RTEC is nationally accreditated through the Council for the Accreditation of Educator Preparation (CAEP). CAEP requires each nationally accreditated education preparation provider to report annually on program impact and outcome measures. This page offers the annual reporting measures for RTEC. RTEC comprises one undergraduate initial teacher licensure program. This initial licensure program was part of the last accreditation cycle.
Endorsement Areas
- Biology
- Chemistry
- Chinese, PK-12
- Computer Science
- Earth Science
- Elementary Education, PreK-6
- English
- French, PreK-12
- German, PreK-12
- History and Social Science
- Journalism
- Latin, PreK-12
- Mathematics
- Mathematics-Algebra 1
- Middle Education, Grades 6-8
- Music: Instrumental, PreK-12
- Music: Vocal/Choral, PreK-12
- Physics
- Spanish, PreK-12
- Theatre Arts, PreK-12
- Visual Arts, PreK-12
RTEC does not offer any advanced-level programs.
CAEP Accountability Measures
Measure 1: Completer Effectiveness and Impact on P-12 Student Learning
Data gathered from RTEC completers and from employers of recent RTEC completers demonstrate that program completers effectively contribute to P-12 student learning growth. Three cycles of completer and employer surveys, the completer forum, and phone conversations with principals including details of how teachers are evaluated, and samples of pre- and post-assessment data shared by RTEC completers show a triangulation of evidence that completers apply in P-12 classrooms the professional knowledge, skills, and dispositions that the preparation experiences were designed to achieve.
Over the course of three cycles of completer and employer surveys several important trends emerged that reflect positively on completer effectiveness in their first year of teaching. On a scale of 1=unsatisfactory 2=basic 3=proficient 4=distinguished, on all but four of 18 items, both completers and employers scored completers as proficient and higher.
The skills that are rated highest (3.1 or higher weighted average) by both completers and employers include: Domain 1) Planning and Preparation: b.ability to plan units and lessons based on state and national standards, students, community, c. ability to provide for differing learning styles and ability levels, d. ability to use formal and informal assessment strategies to evaluation students. Also, Domain 2) Classroom Environment: c. ability to provide learning opportunities that support student's intellectual, social, and personal development; d. ability to create a learning environment that encourages positive student interaction and self-motivation. In one component of Domain 2) Classroom Environment, survey results identified ability to manage student behavior as the one area in which both completers and employers rated completers as slightly less than proficient.
In the third domain, Instruction, all components were rated as proficient or higher but two of these showed the largest difference between employer rating and completer rating-a. ability to use a variety of teaching strategies to engage students, and b. knowledge of effective verbal and non-verbal communication to foster active inquiry, collaboration, and supportive instruction in the classroom. On these two components employers rated completers, on average, 3.0/proficient, while completers rated themselves 3.5, midway between proficient(3) and distinguished (4). In Domain 4) Professional Responsibilities, ability to reflect on teaching and adjust instruction, had the highest ratings, 3.2 employer and 3.5 completer. On eight of 17 items, completers rated themselves slightly higher than employers rated them. This finding prompts some questions for further investigation. Perhaps it demonstrates a mismatch between how completers view the priorities and responsibilities of their role as compared to how principals view them, or a mismatch between how successful and effective completers think they are compared to what principals observe.
Measure 2: Satisfaction of Employers and Stakeholder Involvement
The EPP measures employer satisfaction with completers' preparation for their assigned responsibilities using employer surveys and one-on-one phone conversations with employers/principals. The EPP ensures these methods elicit responses specific to the knowledge and skills corresponding with teaching effectiveness by aligning survey items and phone conversation prompts with the Danielson Framework for Teaching.
Employer survey results, indicated on a scale of 1 to 4 (1=unsatisfactory 2=basic 3=proficient 4=distinguished) show that employers are satisfied with completers' preparation for working with diverse P-12 students and families. On 15 of 18 FFT survey items employers rated completers as proficient (3) or higher, with the highest average ratings of 3.2 for 1) ability to provide for differing learning styles and ability, and 2) ability to communicate and interact with parent/guardians, families, colleagues, and the community to support student well-being. Interestingly, on this latter item regarding communication with families, completers rated themselves lower, with a weighted average of 2.8, than principals rated them, with a weighted average of 3.2.
Qualitative comments made by employers on surveys about completers' work with P-12 students and their families are positive. For example: "[Completer One] is a quick study and is making a positive difference in the lives of her students-academically, social, and emotionally." "[Completer One] takes time to reflect on her lessons and has really worked to make connections with her students and their families." "[Completer Three] has grown a lot this year in the area of classroom management... This summer, [Completer Three] is focusing on responsive classroom training. [Completer Six] has done exceptionally well despite the unprecedented challenges of being a first year teacher during COVID."
In addition to survey results, employer satisfaction with completer preparation for assigned responsibilities with diverse P-12 students is demonstrated in themes that emerged from phone conversations with principals. Several quotes are included here to represent the major themes of: what employers observe about completers' preparedness; what employers know about completers' preparedness according to formal assessments and evaluations; what employers perceive about completers' professionalism and growth in the profession.
Measure 3: Candidate Competency at Completion
RTEC ensures candidates possess academic competency to teach effectively with positive impacts on diverse P-12 student learning and development using multiple sources of data in addition to close advising and mentoring of candidates throughout the program as described in our report.
Candidates' application of content knowledge is evaluated throughout the program by way of: professional education coursework including peer teaching, P4 and P4M practicum feedback forms completed by cooperating teachers across multiple practicum placements, directed teaching evaluations completed with the triad-candidate, cooperating teacher, and university supervisor, GPA checkpoints and PRAXIS II subject area tests, and finally through evaluation of each candidate's CAP, which requires proficiency in the FFT domains and a teacher work sample (TWS). The TWS requires candidates to show pre- and post-lesson assessment data, demonstrating positive impacts on diverse P-12 student learning. The CAP must be presented as a digital portfolio, demonstrating proficiency with technological integration in the field at the time of program completion. These sources of evidence triangulate to show that candidates are prepared for certification upon completion of the program.
Candidates' ability to effectively apply foundational pedagogical knowledge and skills increases throughout the program-from peer teaching exercises to practicum placements and ultimately directed teaching. Upon program completion, candidates' competence to teach effectively by applying foundational pedagogical skills is demonstrated primarily in the CAP and reflected in their directed teaching evaluation, for which proficiency in all areas is the required benchmark.
As the touchstone of our EPP, the Framework for Teaching (FFT) defines components for assessing and evaluating candidates at multiple points in the program, providing a dynamic assessment of candidates' quality at completion in: content knowledge, pedagogical knowledge, pedagogical skills, professional responsibilities, and ability to integrate technology effectively.
Measure 4: Ability of Completers to be Hired in the Area of Licensure
All RTEC completers who sought positions for which they have been prepared are employed in such positions; some remain in Virginia, some returned to their home state to pursue their teaching career.
Additional Program Information
Program Graduation Rates
RTEC graduation rates for the most recent years are:
- 2021-22: 8 Enrolled / 8 Graduated (100%)
- 2020-21: 6 Enrolled / 6 Graduated (100%)
- 2019-20: 5 Enrolled / 5 Graduated (100%)
- 2018-19: 3 Enrolled / 3 Graduated (100%)
- 2017-18: 5 Enrolled / 5 Graduated (100%)
- 2016-17: 11 Enrolled / 11 Graduated (100%)
Ability of Completers to Meet Licensing and/or any Additional State Requirements
The state of Virginia requires teachers to pass several exams in order to be licensed. The exams include the Praxis I, Praxis II (Content Area) Exam, RVE (Reading for Virginia Educators, PK-6 only), and VCLA (Virginia Communication and Literacy Assessment). Once candidates have completed their bachelor’s degree, passed the above mentioned exams, and completed state-mandated requirements for training in First Aid/CPR/AED, Dyslexia, Behavioral Intervention and Support, and Child Abuse and Neglect, they are eligible to apply for licensure with the VDOE.
All RTEC completers have met the requirements for teacher certification in Virginia. The following aggregated exam pass rates from 2016 to 2023 provide evidence of this measure:
- Praxis I - 100% pass rate
- Praxis II - 100% pass rate
- RVE - 100% pass rate
- VCLA - 100% pass rate
Other Consumer Information
- W&L: https://www.wlu.edu/business-office/parents-and-students/tuition-information/tuition-and-fees
- SVU: http://svu.edu/admissions/tuition-and-aid/